![]() China’s Official Statistical Communique covering 2014 Economic and Social Development was released on 26 February. Whether you believe the detail is completely accurate or not, these statistics provide some interesting insights.
China’s Official Statistical Communique covering 2014 Economic and Social Development was released on 26 February. Whether you believe the detail is completely accurate or not, these statistics provide some interesting insights.
We’ve focused on Chinese export, manufacturing and innovation. The three relevant tables are shown here. So what do we learn?
Comparing China Statistics for Production and Export
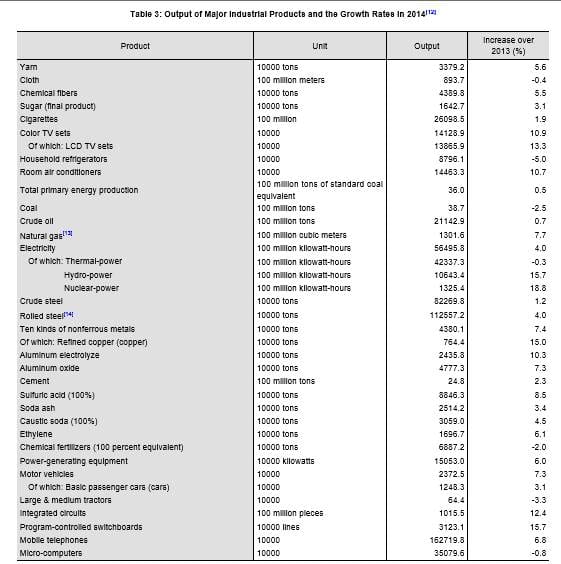
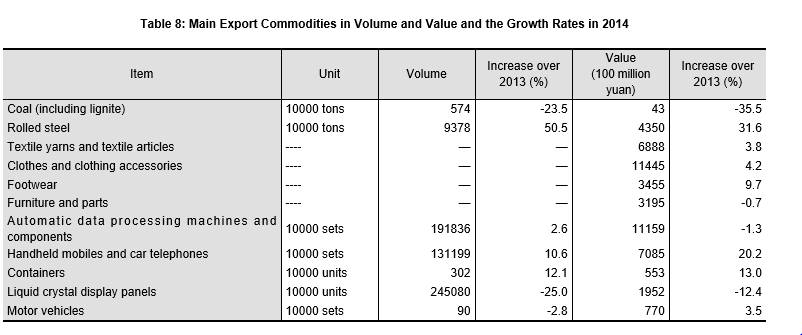
Coal production has dropped, but only slightly (2.5%). Coal exports have dropped a staggering 35.5% The difference has to be due to increased demand for power within China. This is probably both consumer and industrial demand. Statistics from 2013 are similar, so this is an ongoing trend.
Production of household electrical items like TVs and air conditioners grew by over 10%. Yet exports of LCD displays dropped. The figures suggest a growing Chinese middle class buying consumer items. So manufacturers can target a local market. Export still remains important, though.
We also note the fastest growing exports were rolled steel, mobile phones and containers. This reflects the gradual ‘growing up’ of Chinese manufacturing to focus more on hi-tech areas. Traditional sectors like textiles, footwear and clothing still grew, but more slowly. They face increased competition from other countries with low cost of production.
Copycats or Innovators – what does the Patent Data Tell Us?
Patent data gives additional insights into Chinese manufacturing.
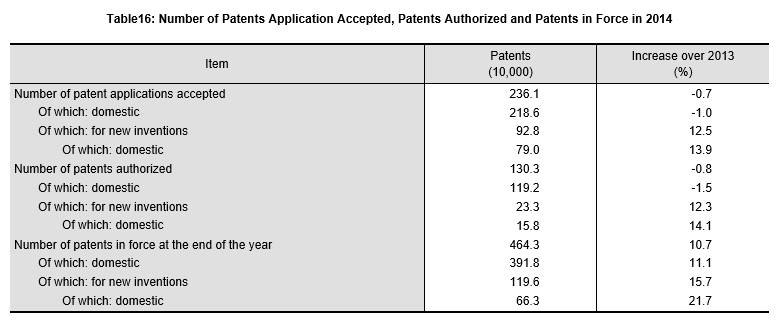
First, note that a third of all patents applied for in China were from domestic companies seeking to protect new inventions. That suggests a high level of innovation, rather than the ‘copy cat’ approach often associated with China.
On the downside, domestic new inventions were only around 12% of all patents authorised. What’s causing the gap?
It could be time lag – many patents have been applied for but not yet authorised. (In June last year we wrote about Chinese manufacturer plans to increase R&D spending. That could have led to more patents.) Or it could be that domestic companies are not yet used to making patent applications, so make mistakes. We can’t tell from just one year of statistics. Nor were statistics on patents in the equivalent communique last year. That in itself is significant. Chinese policymakers are now tracking patents as a marker of development and innovation.
What do All These Statistics Mean for Hornet and Our Customers?
First, Chinese exports continue to grow. Despite dire predictions, Chinese manufacturing is still competitive even in low-tech sectors.
Second, China is more and more innovative and inventive. We wrote last year about China’s production of 3D houses, for example. And Forbes reports that Shanghai seems poised to take over from Silicon Valley as top global tech hub.
On a more low-key note, at Hornet, we’re interested in the rapidly increasing export of ‘containers’. We source a wide variety of packaging for clients in all kinds of industries, which includes containers as well as bags and tissue paper. We source both low volume packaging for promotional campaigns, and branded bottles, jars and containers for ongoing production. We’re only a small part of the national statistic, but it’s good to see we’re working in a growth area!